Google Ads Score
If your business runs Google Ads, this score tells you how efficiently those ads are turning your budget into real leads.
In your app: /google-ads-score/
The Google Ads Score measures how well your paid search advertising is working. It looks at whether you're spending your budget in a way that produces leads at a reasonable cost - not just whether you're spending money. If your ads are active and converting, the score rises. If costs are climbing without a matching gain in leads, the score will reflect that.
If your business is not currently running Google Ads, the score shows N/A instead of a number. That is perfectly normal - see the note at the bottom of this page.
What's on this screen
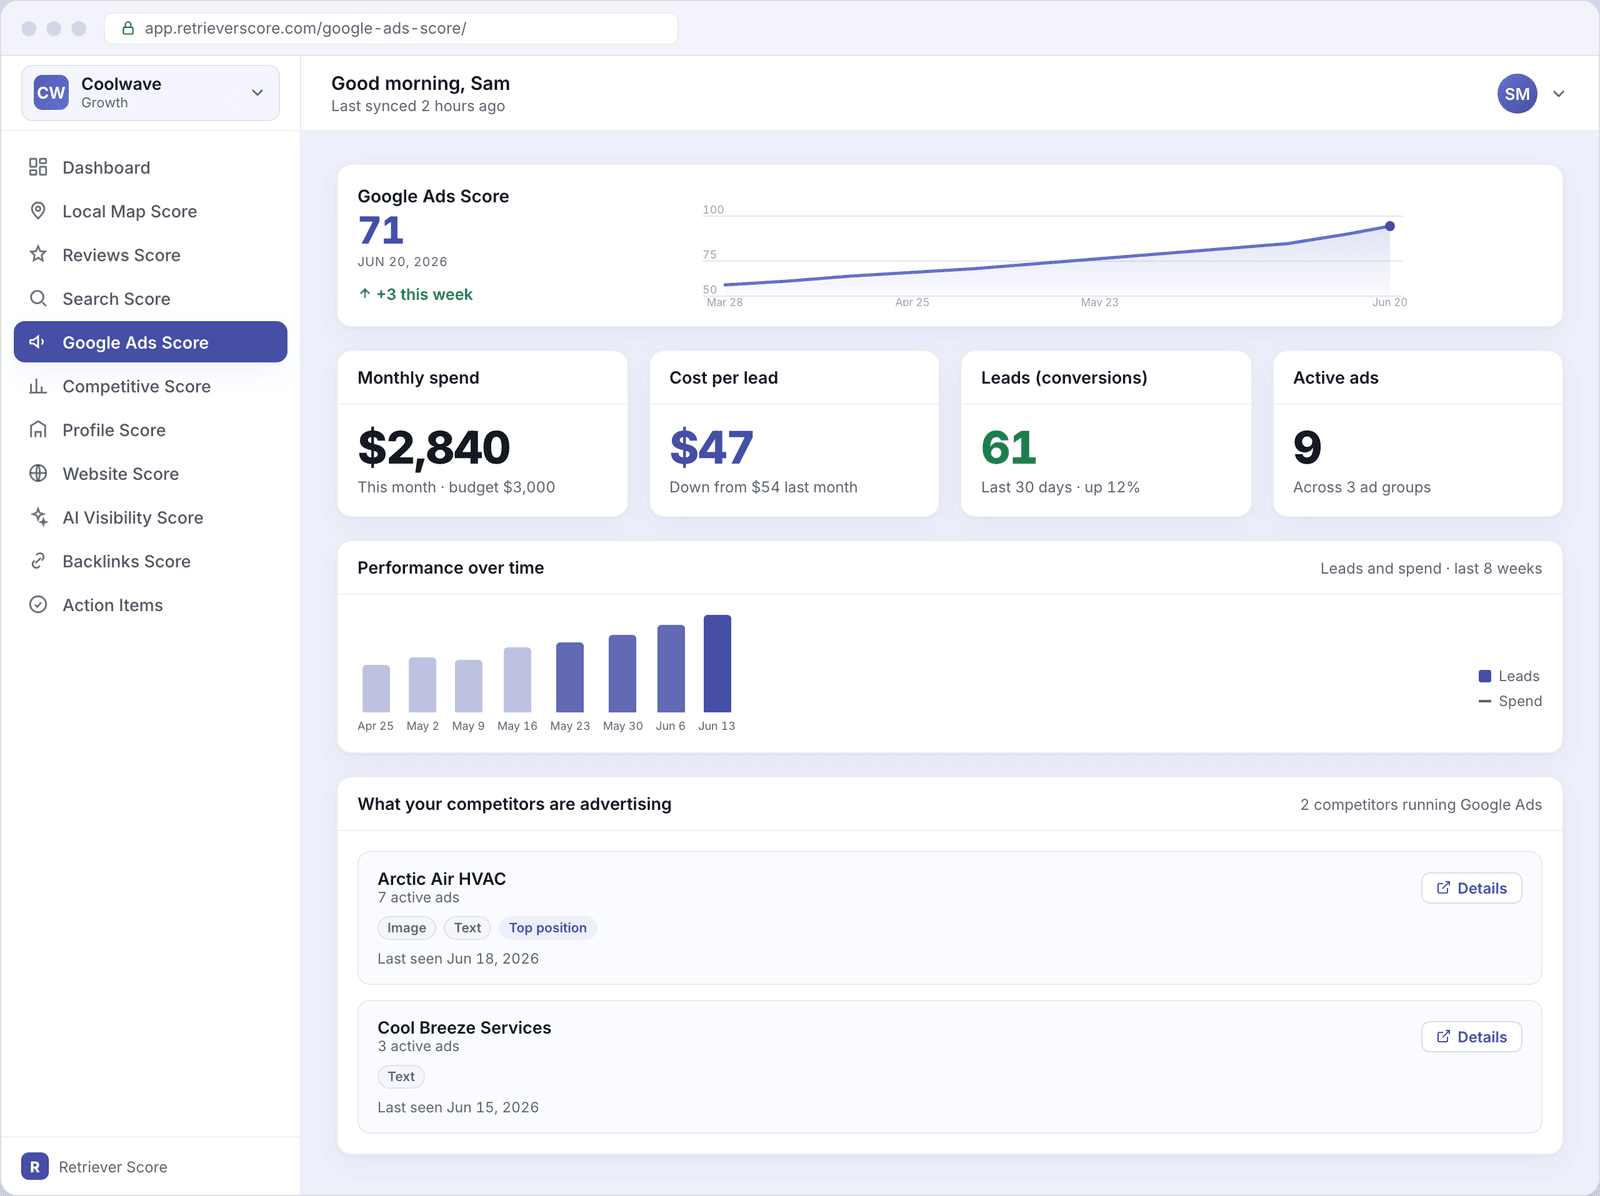
Score timeline
The large number at the top is your Google Ads Score - a 0-to-100 grade. The line chart beside it shows how the score has moved over the past 12 weeks. A score in the blue (60-79) range means your ads are working reasonably well. Green (80-100) means you're getting strong results for your budget. Gold (40-59) or red (below 40) is a signal to review your campaigns - either spend is too high for the leads coming in, or your ads aren't reaching the right searches.
Monthly spend
How much your business has spent on Google Ads this calendar month, alongside your current budget. If you're pacing well below your budget, your ads may not be showing as often as they could. If you're approaching or hitting the budget cap early in the month, potential customers could be missing your ads in the second half of the month.
Cost per lead
The average amount you're paying for each lead (conversion) your ads produce. This is one of the most important numbers on the screen. A lower cost per lead means your ads are efficient - you're getting more customers for each dollar spent. Tracking this number week over week tells you whether your campaigns are improving or slipping. If cost per lead is rising, your ads may be bidding on searches that don't convert, or your landing page may need attention.
Leads (conversions)
The number of leads your ads have generated in the last 30 days. A "lead" counts when someone clicks your ad and then takes a meaningful action - fills out a form, calls your number, or books a job. This is the bottom-line result of your ad spend. Watching this number alongside your spend tells you the real story: are you getting more leads, or just spending more?
Active ads
How many individual ads are currently active across all your ad groups. More active ads is not automatically better - what matters is whether those ads are matched to the right searches and leading people to a page that makes them want to call. This tile also shows how many ad groups those ads are organized into.
Performance over time
A weekly bar chart showing your lead volume (the bars) over the past eight weeks. Use this to spot trends: are leads growing week over week? Did a campaign change cause a spike or a drop? A steady upward trend is the goal. A week where leads fell while spend stayed flat is worth investigating.
What your competitors are advertising
A list of the competitors in your market who are also running Google Ads. Each card shows the competitor's name, how many active ads they have, and what ad formats they're using (image, text, or video). Click the Details button on any competitor to see the actual ad creatives they're running - the headlines, copy, and where their ads are showing up. Knowing what your competitors are saying in their ads can help you write more effective ads of your own.
When the score shows N/A
If your business is not running Google Ads, the score displays N/A rather than a number. This is not a penalty - an N/A Google Ads Score is simply not counted toward your overall Retriever Score. Businesses that choose not to advertise on Google are not disadvantaged in their total score compared to businesses that do.
The competitor ads section still shows even when your own score is N/A. That intelligence is useful regardless - you can see what competitors near you are spending money to advertise, which often reveals gaps in the market you could win through other means.
If you start running Google Ads, Retriever Score will detect the activity within the next scan cycle and begin scoring your campaigns automatically.
Watch cost per lead, not just total spend. Many owners focus on how much they're spending, but the number that actually tells you whether ads are worth it is cost per lead. If you're paying $45 per lead and jobs average $500, that math works. If cost per lead creeps to $150, it's time to talk to whoever manages your campaigns about which searches to cut or which ads to rewrite.
What to check each week
- Is cost per lead trending down? Good campaigns get more efficient over time as you turn off ads that don't work and scale up the ones that do.
- Are lead counts growing? If spend is flat but leads are up, your campaigns are improving. If spend is up but leads are flat, investigate.
- Are competitors running more ads than last week? A sudden increase in competitor ad activity can push your ads lower on the page and raise your costs - worth keeping an eye on.
- Check your Action items - Retriever Score will flag unusual patterns (a large cost-per-lead jump, a drop in active ads) and suggest what to look at.